To rationalize my discussion I shall consider thecase: 1.The Impact of Subside on Fuel Price
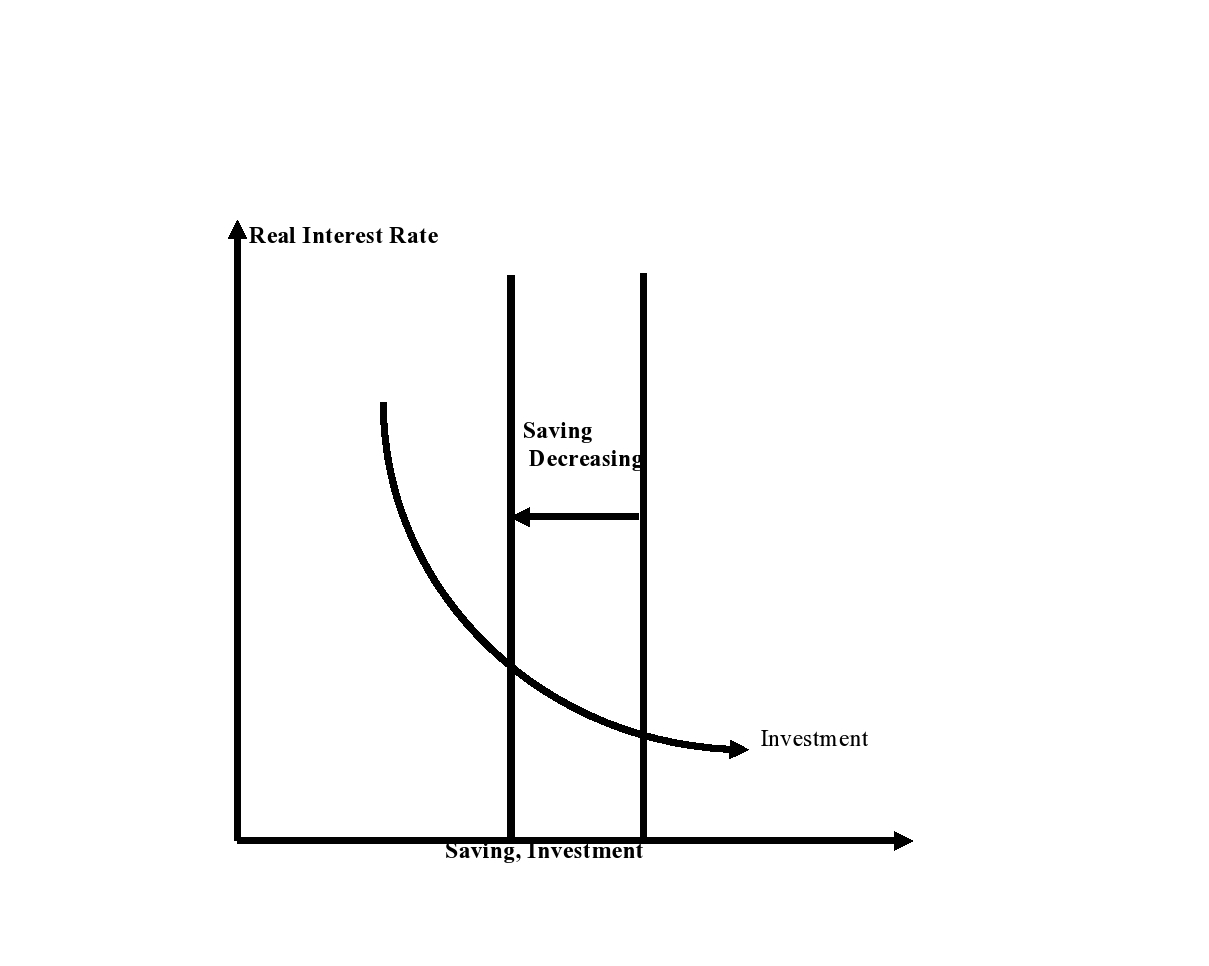
1. The Impact of Subside On Fuel price: If the government continues to provide subside on fuel price then govt. spending will increase increase in government spending will decrease the National Saving.Because from classical macro economics we know:
National Saving= Total Saving =S= (Y-T-C)+ (T-G)= Private Saving + Public Saving
Here Public Saving = Tax - Govt. Spending
Decrease in national saving will decrease the supply of loanable funds to the Investors. Decrease in supply of loanable funds will increase interest rate. Increase in interest rate will decrease the overall investment in the economy.
Therefore increasing the subside on fuel price will decrease Investment in Private Sector.
The consequences of low investmnets are:
1.Unemployment
2.Availability of low fund to power plant projects
3. Shortage of electricity
4.Low Growth in Industry
5.Low GDP Growth
Therefore to make sure the availability of supply of loanable funds govt. will increase the money supply and inflation will rise. The senior citizens will be harmed by the policy.This will also harm the low income people significantly.
My Opinion regarding the subside of fuel price is quite clear that Govt. should increase the fuel price and subside should not be continued for the long run welfare of Macro Economy.
Executive Summary: Here I have attempted to find out the problems and opportunities of SME in Bangladesh. I clearly acknowledge that I making this paper on the basis of secondary information from Internet and related Jounals published on the topics. The report is not absolutely based on Primary information.
The economy of Bangladesh is at the crossroads. Rapid liberalization has put most existing
industries under severe strain because of their inability to compete with consumer goods being
freely imported after the withdrawal of quantitative restrictions and the drastic reduction of
import tariffs. For the fiscal year 2004-2005, the erstwhile 4-tier duty structure of 7.5, 15, 22.5
and 30 percent has been cut down to 3 tiers, 7.5, 15 and 25 per cent, the weighted average being
16.44 percent. According to the budget speech of the Finance Minister, this would cause an
estimated Bangladesh taka (BDT) 11 billion (USS 186 million) loss of revenue to the
government; but there are no estimates yet about likely losses to the domestic trade and
economy of the country from the flood of imported consumer and industrial products -
cosmetics and toiletries, food and beverages, textiles and apparels, footwear and leather goods,
chemicals and pharmaceuticals, light engineering products, machine tools, hand tools and so on.
All these products (all under the SME category, and the rate at which the glittering
multistoreyed shopping malls are springing up in Dhaka and other major cities of the country is
perhaps a good indicator of the rate of displacement of domestic products by imported
merchandise. Although some producers have been successful in improving their products and significantly increasing external market access, most are languishing.
Both equity and growth being of concern to the Government, the priority is to accelerate
GDP growth in a pro-poor manner from the present 5.5 percent to 8-10 per cent (Annex-I).
Agriculture, besides being the mainstay of the economy, is also important for increasing
employment and reducing poverty. The contribution of agriculture and fisheries to the GDP in
2003-04 was 22.83 per cent at 1995-96 constant prices (crop 12.98 per cent. livestock 2.90
per cent, forestry 1.84 percent, and fisheries 5.15 per cent) (Annex-II) while they provided
over 72 percent of the total employment. Correspondingly, the manufacturing contribution to
GDP in 2003-04 was 16.25 per cent accounting for only 5.4 percent of the total employment.
Whether to achieve the committed Millennium Development Goals (MOGs) of 2015 or the
targets of the National Strategy for Economic Growth, Poverty Reduction and Social
Development, commonly known as the Poverty Reduction Strategy Paper (PRSP), the
development process of Bangladesh must strive to expand employment creation opportunities
very rapidly. The scope of additional absorption of labour in agriculture being somewhat
limited, the best potential for this lies in the manufacturing sector. Inspite of droughts, floods,
cyclones and various other natural or management related disasters, the agricultural sector of
growth of the services sector has also been fairly robust. It is the manufacturing sector's
contribution to the GDP that has remained nearly stagnant at around 15 per cent and its
growth rate at 7.41 percent (estimated values of 2003-04 at 1995-96 constant prices).
NB:from Asia-Pacific Tech Monitor, Sep-Oct 2004 issue, pp. 44-56. Mr. Abdul Awal Mintoo is President of the Federation of Bangladesh Chambers of Commerce and Industry.
Introduction: The abbreviation SME occurs commonly in the European Union and in international organizations, such as the World Bank, the United Nations and the WTO. The term small and medium businesses or SMBs is predominantly used in the USA. EU Member States traditionally have their own definition of what constitutes an SME, for example the traditional definition in Germany had a limit of 255 employees, while, for example, in Belgium it could have been 100. But now the EU has started to standardize the concept. Its current definition categorizes companies with fewer than 10 employees as "micro", those with fewer than 50 employees as "small", and those with fewer than 250 as "medium".By contrast, in the United States, when small business is defined by the number of employees, it often refers to those with fewer than 100 employees, while medium-sized business often refers to those with fewer than 500 employees. Both the US and the EU generally use the same threshold of fewer than 10 employees for small offices (SOHO). In most economies, smaller enterprises are much greater in number. In many sectors, SMEs are also responsible for driving innovation and competition. In India, the Micro and Small Enterprises (MSEs) sector plays a pivotal role in the overall industrial economy of the country. It is estimated that in terms of value, the sector accounts for about 39% of the manufacturing output and around 33% of the total export of the country. Further, in recent years the MSE sector has consistently registered higher growth rate compared to the overall industrial sector. The major advantage of the sector is its employment potential at low capital cost. As per available statistics, this sector employs an estimated 31 million persons spread over 12.8 million enterprises and the labour intensity in the MSE sector is estimated to be almost 4 times higher than the large enterprises. In South Africa the term is SMME for Small, Medium and Micro Enterprises. Elsewhere in Africa, MSME is used for Micro, Small and Medium Enterprises. Industry Canada defines a small business as one that has fewer than 100 employees (if the business is a goods-producing business) or fewer than 50 employees (if the business is a service-based business), and a medium-sized business as fewer than 500. In New Zealand a SME has to be 19 people or fewer.
Abstract: This report is an attempt to find out the financial position of Sonargao Plumbing on the basis of the Financial Statements. We have attempted to find out whether the firm is in a good position or not.After studying the report one will be able find the Answer of the Following questions:
problems of Sonargao Plumbing
Strength & Weakness of Sonargao Plumbing
Growth prospect of Sonargao Plumbing
Introduction: Sonargaon plumbing is a small manufacturer of plumbing supplies located in Sonargoan Narayanganj
In order to answer the Following:
What is the number of shares outstanding? How much Sonargaon Pay in cash Dividends in 2010?
Do any of the ratios Of Soanrgaon Plumbing indicate possible problem areas?
Do the Changes form 2009 from 2010 offer that the firm is growing stronger or weak?
We will calculate the following ratios:
a) Liquidity Ratios: It indicates the extent to which Current Liabilities (CL) covered by assets to be converted to into cash in the near future.
CA
Current Ratio:
CL
CA- Inv.
Quick Ratio:
CL
b) Asset management Ratios: It indicates how well the company is managing its assets.
A/C Receivable
1.Days Sales Outstanding:
Sales /360
Cost of Goods Sold
2.Inventory turnover:
Inv.
Sales
3.Total Asset Turnover:
TA
c) Profitability Ratios: It shows the combined effects of Liquidity, Asset Management and Debt Management on operating results.
Gross Profit
1.Gross Profit Margin :
Sales
EAT
2.Net profit Margin:
Sales
EAT
3.Return On Asset:
TA
EAT
4.Return On Equity:
TE
d) Debt management Ratios:
EBIT
Times Interest Earned(TIE):
I
e) Market value Ratios:
Market Price per Share
1)Price Earning Ratios(PE):
EPS
The Income Statement and Balance sheet for Sonargao Plumbing are given below:
SonargaoPlumbing
Comparative Income Statement
2010
2009
Sales
75,000
70,500
Cost Of Goods Sold
(44,000)
(42,500)
Gross Profit From Sales
31,000
28,000
General And Administrative Expenses
(15,500)
(11,000)
operating Income(EBIT)
15,500
17,000
Interest Expenses(I)
(840)
(10,50)
Pre Tax Income(EBT)
14,660
15,950
Taxes
(4,100)
(44,60)
Net Income(EAT)
10,560
11,490
Dividends Declared And Paid
5,737
4,500
Sonargao Plumbing
Comparative Balance Sheet
2010
2009
Cash
2,280
2,157
Marketable Securities
1,400
1500
A/C Receivables
4,500
2500
Inventories
11,000
6,000
Total Current Assets
19,180
12157
Plant and Equipment
22,000
18,000
(Less: accumulated Depreciation)
Land
9,000
9,000
Total Fixed Assets
31,000
27,000
Total Assets
50,180
39,157
A/c payable
4,500
1,100
Notes Payable
7,200
3,000
Accrued Liabilities
1,300
1,000
Total Current Liabilities
13000
5,100
Bank loan
4,200
4,200
Mortgaged Loan
4,200
5,900
Total Long Term Liabilities
8,400
10,100
Total Liabilities
21,400
15,200
Common Stock (Tk.1Per)
10,000
10,000
Paid In Excess Par
3,000
3,000
Retained Earnings
15,780
10,957
Total Equity
28,780
23,957
Total Liabilities And Equity
50,180
39,157
Answer of Question1:
The No. of Share Outstanding = Book Value per Share × Common stock
= 1 × 10,000
= Tk. 10,000
Sonargao Plumbing
Statement Of Retaining
2010
Beginning R/E
10,957
EAT
10,560
Less: Dividend to P/S
Less: Dividend to C/S
Addition to R/E
Ending R/E
15,780
Hence,
Dividend Paid In 2010 to the C/S = Beginning retaining + EAT (2010) – Retaining Earning (2010)
=10,957 + 10,560-15,780
= Tk. 5,737
In order to answer the Questions 2 & 3 we have calculated the following ratios of Sonargao Plumbing.
Sonargao Plumbing
Ratio Calculation
Ratios
Formula
Calculation(2010)
Calculation(2009)
2010
2009
Industry Average
Liquidity Ratio:
Current Ratio
CA
CL
19180
13000
12157
5100
1.4 Times
2.38 Times
1.4 Times
Acid test (Quick) Ratio
CA- Inv.
CL
19180-11000
13000
12157-6000
5100
0.629 Times
1.207 Times
0.9 Times
Asset Management ratio:
Days Sales Outstanding
A/C receivable
Sales/360
4500
75000/360
2500
70500/360
21.6Days
12.765 Days
45 Days
Inventory turnover
Cost of goods Sold
Inv.
44000
11000
42500
6000
4 Times
7.083Times
5 Times
Total Asset Turnover
Sales
TA
75000
50180
70500
39157
1.494 Times
1.800 Times
1.3 Times
Profitability Ratio:
Gross Profit Margin
Gross Profit
Sales
31000
75000
28000
70500
41.33%
39.71%
30%
Net profit Margin(NPM)
EAT
Sales
10560
75000
11490
70500
14.08%
16.297%
16%
Return On Asset(ROA)
EAT
TA
10560
50180
11490
39157
21.044%
29.34%
25%
Return on Equity(ROE)
EAT
TE
10560
28780
11490
23957
36.69%
47.96%
10%
Debt Management Ratio
Times Interest Earned(TIE)
EBIT
I
15500
840
17000
1050
18.45 Times
16.19Times
12 Times
Market Value Ratio
Earnings per Share
EAT – Div.to Preferred Stock
No. of Share Outstanding
10560-0
10000
11490-0
10000
1.056
1.149
Price Earning Ratio(PE)
Market Price per Share
EPS
22
1.056
18
1.149
20.83
15.665
14
Problems in Sonargao Plumbing Ratios:
Liquidity Position:
1.Weakness in liquidity: The Current ratio for Sonargao Plumbing in 2010 is 1.4 times and in 2009 are 2.38 times. Here the industry average is 1.4 times. Although the liquidity position of Sonargoa Plumbing in 2010 is the same as was in Industry average but with compared to its liquidity position in 2009 is somewhat weak. The weakness in the liquidity can be explained by quick ratio. The quick ratio in 2010 is below the Industry Average and that of in 2009.
2.Holding More Inventories:The reduction of the quick ratio of Sonargao Plumbing in 2010 below Industry average and that of 2009 indicates that it is holding more inventories. If the company can collect the Receivables, it can pay off the Short term liabilities even without liquidating the Inventories.
Therefore our evaluation of the liquidity position of Sonargao Plumbing is fairly poor.
To get why it is in the situation we shall consider the values of Asset Management ratios.
Asset Management:
3.Weakness In Collecting Receivables: The average collection periods of the Receivables for Sonargao plumbing in 2010 is below the Industry Average and more than that of in 2009.With compared to 2009 it is not well enough to collect its Receivables.
4.Low Inventory Turnover: The Inventory turnover in 2010 is below Both Industry Average and that of 2009 which again indicates that Sonargao Plumbing is holding excessive inventories.
5.Low Asset Turnover: The Total Asset Turnover is slightly above the Industry average but it is below the value of 2009 which indicates that its sales have decreased significantly in 2010 with compared the sells performances of 2009.
Therefore after considering the Asset management ratios we have obviously found that Sonargoan Plumbing has a Liquidity Problem and its sales are low.
Profitability of Soanargao Plumbing:
6.Gross Profit: The gross profit margin of Sonargao Plumbing for 2010 is above the Industry Average and that of 2009.
7.Low Net Profit Margin: Although Sonargao Plumbing has good gross profit but its net profit margin (NPM) is below the Industry average and that of 2009 which indicates that its sales are too low and its costs are very high.
8.Low ROA:The ROA for Sonargao Plumbing for 2010 is below Industry Average and that of 2009 which indicates that this low ROA is due to the company’s above average use of debt.
9.High ROE: But the ROE indicates that Sonargao Plumbing has ROE above Industry average and that of 2009. Therefore it has used debt normally not excessively.
Its Debt management is well enough.It will be confirmed after examining the debt Management Ratio.
Debt Management of Sonargao Plumbing:
10.The Times Interest Earned (TIE) of Sonargao Plumbing is above the Industry average and that of its 2009 values. Hence the company is not going to be bankrupt rather it is managing its debt well enough. Its low ROA is due to its low sales and high cost.
Stock Market Performances of Sonargao Plumbing:
11.Price Earning Ratio of Sonargao Plumbing for 2010 is above the Industry Average and that of the values of 2009. Hence It has high Growth prospect.
Strength of Sonargao Plumbing:
Sonargao Plumbing is well enough to manage its Debt.
Sonargao Plumbing is doing well in collecting the Receivables with compared to the Industry Average.
Sonargao Plumbing has a high Growth Prospect in the stock market. It is not a risky firm.
Weakness of Sonargao Plumbing:
Sonargao Plumbing has weak Liquidity.
It has excessive inventories.
It has low sales volume.
It has high cost.
Recommendation: Though Sonargao Plumbing has some problematic areas, it can overcome the problems thus:
By increasing the sales volume giving more emphasize on marketing and sales department performances.
By minimizing the cost to earn the maximum profit.
Keeping the inventory to optimal amount.
Conclusion:In a nutshell we recommend Sonargao Plumbing to be more efficient in managing the asset, maintaining sufficient liquidity, maintaining healthy sales volume and minimizing the cost.